
I am a data scientist who has most recently focused on high scale entity analytics, or the creation of person views of data composited from multiple structured sources. I leverage my formal training in the lab sciences to develop methodologies for the characterization of application workloads for large scale computing environments. I draw from an array of data sources like application logs, ganglia/nagios, iostat, sar, vmstat to build a picture of the resource consumption model for an application. These models can be used to estimate workload sizes, as well as profile deployed workloads to ensure they are within expected ranges.
I’ve used these skills both in the lab and at customer sites. I support the largest commercial and federal Master Data Management installations in the world, ranging from the hundreds of millions to billions of records under management. One particularly interesting statistic is over 80% of the prescription data in the United States flows through matching technology that I have helped tune. Commercial customers that I have supported include:
Adobe, Allstate, BNC, CapitalONE, Countrywide, CSAA, CVS/Caremark, DELL, Emdeon, FedEx, Humana, Intercontinental Hotel Group (IHG), Microsoft, Petsmart, Quest, Surescripts, UHG, UPMC, Walgreens, Walmart, Wellpoint, Wells Fargo
My experience combines deep backgrounds in workload analytics and data set visualization. Using these skills I’m able to help make workloads run faster and more efficiently, and, more importantly, help customers determine the cost of a particular workload so they can better determine the benefit of running that workload over another.
Portfolio :: selected visualizations
A core tenant to my approach to analytics is developing ways to visualize an entire data set so we can see emerging patterns that are not typically visible when looking at summary dashboards. In parallel to this objective, visualizations should be beautiful, yet subtle and engaging. Sparking visual interest from the viewer draws them in, and provides a deeper understanding of the underlying patterns exposed by a well designed visualization.
Click the title to see the graphic and description.
Fault injection testing on kubernetes
This is a time series summary of multiple layers of metrics during fault injection testing on a kubernetes deployment.
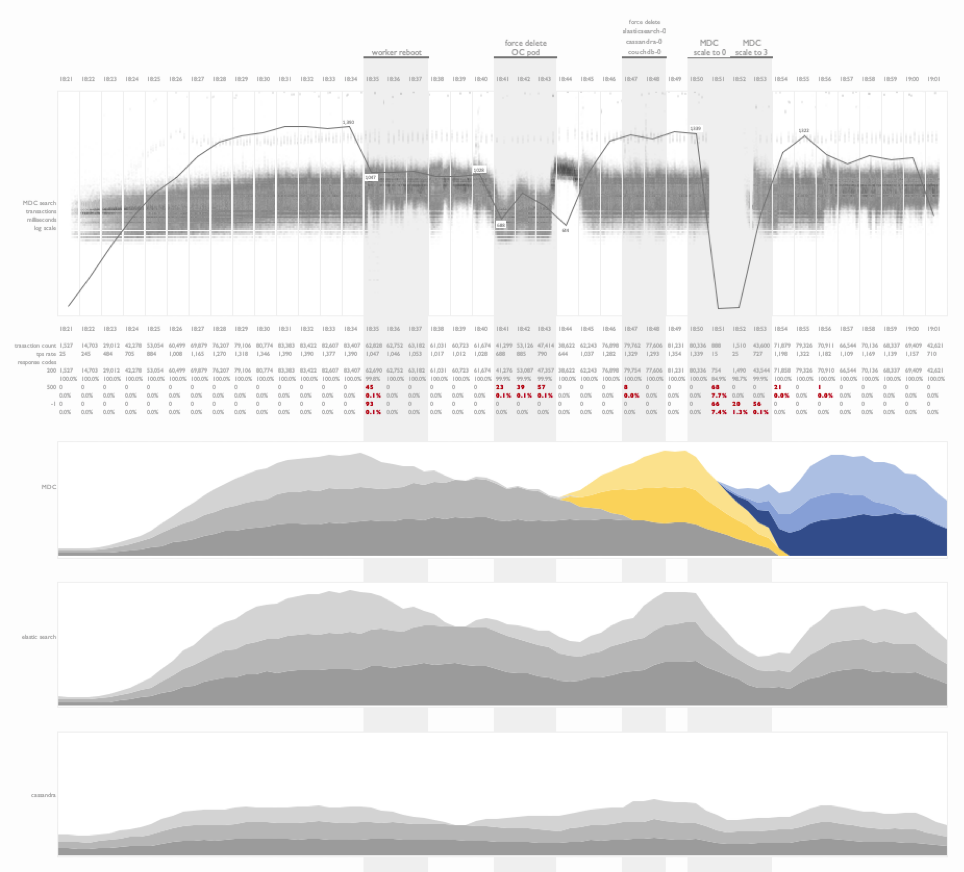
Project timeline and outcome
In this visualization I have combined combined a project timeline with test results from a workload profiling sequence following the deployment and tuning of an application on a clustered database environment for the first time. This is an information rich view of the project outcome that illustrates the progress made over the duration of the engagement. Tools like these are helpful in explaining software deployment cycles and the tuning investments required for at-scale projects.

Name token count regression study
An interesting example of the use of linear regression analysis to identify the normalized comparison latency for a person-search workload as the number of tokens in a name is increased. This experiment design was used to compare a baseline comparison function COMP1 to multiple tuning efforts of a new comparison, COMP2.

Weather data
This is an example of the visualization of daily weather readings spanning a decade’s worth of data from a weather station in Brazil. The objective of this plot was to identify seasonal weather patterns in a specific region and the subsequent replication of these patterns in a controlled environment.

Fault injection testing on DB2 Purescale
This visualization focused on illustrating the impact of fault injection during a cluster test. Faults include the soft and hard removal of nodes from a clustered database while three types of transactions were issued against a dataset stored on the cluster. Impacts to the workload were noted, as well as recovery times. Additional CPU metrics from the application and database tiers were presented below the transactional time series plots.

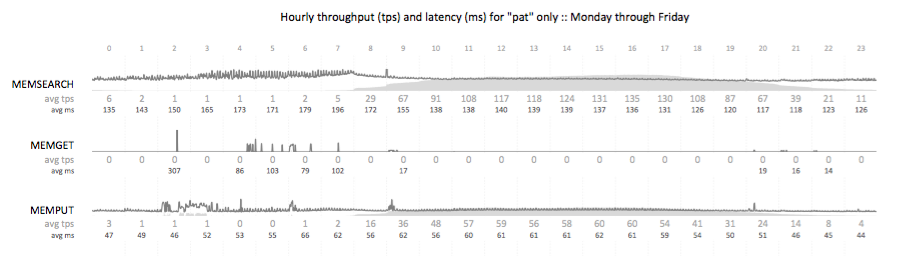
Impact of store openings on transaction rates
A transactional summary view of API calls from a B2C nationwide search workload. This visualization illustrates the ramp up of traffic (light gray) as the day progresses, and the stabilization of transactional search latency (dark gray) as the database buffer pools warm and the physical read rate drops. My favorite portion of this visualization is the illustration of the impact of store openings across time zones in the United States on the transaction rate.
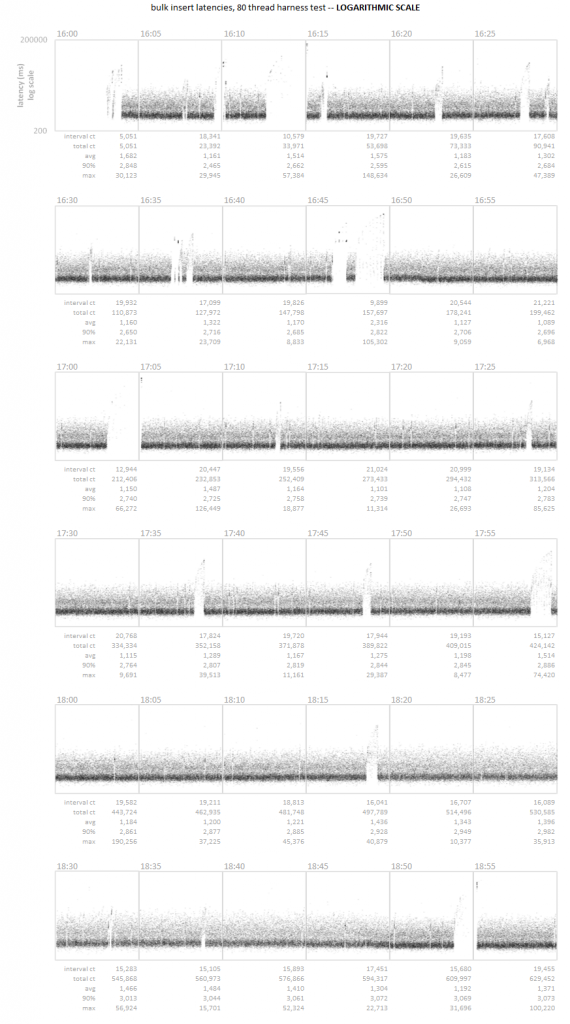
Time series scatter plot
A time series latency scatter plot that allows for the visualization of all transactional latency values captured over the course of three hours. In this particular case, the customer was unable to detect a series of micro-outages using their standard 5 minute sample interval. Visualizing the entire data set allowed for the rapid identification of the pattern.
Professional Background
Click to expand each job title for a description.
Senior Systems Architect, Performance — Collibra
1,000 employees | 2020 – present
Architect, Workload Analytics — IBM Entity Analytics
Austin, TX | 400,000 employees | $100B, $250M group | 2010 – 2020
Initiate was acquired by IBM in 2010, joining an existing portfolio of MDM solutions. I was responsible for setting MDM portfolio performance strategy, focusing on the development of scaling models for MDM workloads across multiple platforms. Our highest scale solution was based on the core Initiate probabilistic matching engine. I drove the development of large scale system simulations with realistic workloads on DB2 clustered environments. Developed new data visualization techniques for large scale systems, plotting millions of transactions per page for a complete view of cross-stack performance data. Conducted deep performance analytics for a variety of large scale customer installs including Adobe, Allstate, BNC, CVS, Emdeon, Quest, Walgreens, Walmart, WellPoint and other large scale public sector accounts.
In 2014 I transitioned to our Big Match for Hadoop product team, leading the workload analytics effort for profiling probabilistic workload footprints and scaling characteristics, developing predictive models for resource consumption. Typical person-record counts scaled to the billions of records, processing 10+ million comparisons per second and 10^12 or more comparisons per day. I developed a working knowledge of hadoop, focusing on Hortonworks and IBM’s propriety version of HDP, called Big Insights (based on IOP). Most of my Hadoop experience focused on YARN/MR memory tuning for probabilistic workloads, as well as region design strategies within Hbase.
Senior Program Manager, Product Performance — Initiate Systems
Austin, TX | 340 employees | $90M | 2007 – 2010
Implemented product performance program focusing on R&D release-to-release performance metrics based on internally developed testing harness and automated data collection. Developed key analytical tooling for field diagnostics including Excel-based macro driven workbooks that simplified field engagements. Drove detailed technical root cause analysis for “performance code red” client engagements including multiple Fortune 100 accounts (Allstate, Barnes & Noble, BNC, CapitalONE, Countrywide, CVS, DELL, FedEx, IHG, Microsoft, Quest, UHC/UHG, and Walgreens). Extensive experience tuning application stack from custom application through Oracle, Oracle RAC, down to EMC Symmetrix, FC, EFD. Skilled in time series analysis spanning mulitple data sources including custom logs, Oracle AWR, iostat, sar, nmon, perfmon and other data sources. Specialization in data aggregation and visualization. Developed 2D frequency analysis technique providing a portable metric for cross-site performance characterization and comparison.
Program Manager, Strategic Technical Partnerships — Initiate Systems
Austin, TX | 150 employees | $50M | 2006 – 2007
Responsible for inbound technology partnerships into the R&D group. Established partner evaluation process used for 4+ years to evaluate embedded technologies. Negotiated multi-year OEM agreement for embedded ETL tool and key outsourcing partnership with Czech based development firm. Technical management of key partnerships including IBM, Oracle and multiple best of breed vendors.
Director of Programs and Infrastructure — Interactive Silicon, Inc.
Austin, TX | startup | 2001 – 2003
Key member of senior management team that drove development of sophisticated server accelerator product; led cross-functional integration of sales, marketing and development efforts to realign a hardware project that strayed far off schedule. Boosted on-time delivery rate by >90% extending schedule visibility 6-fold through custom scheduling system. Drove cross-functional project teams (engineering, QA, manufacturing, marketing) integrating product development processes. Leveraged consulting and networking expertise to deploy MMB2, MMB3, TSCPT, CSTK, NetBench and WebBench tools.
Project Manager, Product Engineering — Merinta, Inc.
Austin, TX | startup | 2000 – 2001
Managed end to end development of first feature-rich Linux IA supporting RealPlayer 8, Flash 4 and W3C standards. Led initial product management effort for Internet Appliance industrial design (vendor evaluations included IDEO, Fitch and Frog) and client software development, then transitioned to the lead project management role within the engineering group, leading the project management team directing a group of 30 engineers. Drove product definition, planning, scheduling and monitoring for a sophisticated Internet Appliance embedded operating system and enterprise remote management software capable of scaling to hundreds of thousands of clients. Responsible for the integration of marketing, sales, development and quality assurance efforts.
Sales Engineer, Professional Services — Boundless Technologies, Inc.
Hauppauge, NY & Seattle, WA | $85M public co. | 1998 – 2000
Owned technical sales and emergency response support for signature accounts. Key in the development and selling of product positioning with clients. Specialized in server based computing products (MetaFrame and Terminal Services). Drove revenues from $3M (1997) to $8M (1998) & $13M (1999) leading technical sales effort for WBT product line. Managed technical relationships with key Fortune 500 clients including Sears, IBM, Microsoft, Citrix and HP.
Network Consultant — NSI Media, Inc.
Farmingdale, NY | private co. | 1996 – 1998
Built an extensive client base in the network consulting arena. Developed expertise with a variety of technologies including wireless ISP services, file, print, messaging, and database infrastructure design. I was an early adopter of 802.11 technologies applied in wireless ISP venture; achieved profitability within 3 months, leading the development, sales, and delivery of a new service for this small business.
Education and Training
Click to expand each educational entry for a description.
Master of Science in Engineering — University of Texas, Austin 2003
Specialization in Engineering Management
A master in Engineering Management complements practical experience with formal training in a variety of key management areas. Co-sponsored by UT’s College of Engineering and McCombs School of Business, the program provides a unique combination of technical and business course work. Thesis focused on improving business and development process integration.
Master of Science — University of Notre Dame 1996
>Geological Sciences, Specialization in Inorganic Geochemistry
Formal education in the sciences provided a stable foundation in developing and proving processes as well as the management of complex projects. Thesis combined COTS analysis techniques to push process detection limits to levels 3 times lower than previously achieved. Techniques were used to analyze lunar samples due to the increased process sensitivity.
Bachelor of Science — University of Notre Dame 1994
Geological Sciences | Notre Dame, IN
Outstanding Technical Achievement Award — IBM 2019
This award was granted for my work on our MDM Express and Entity Insights products. I developed a custom algorithm and weights design spanning multiple locales and led accuracy testing with US, UK and French datasets.
I also conducted scalability validation and tuning for single VM record sizes ranging from 1m to 25m+.
Outstanding Technical Achievement Award — IBM 2014
Master Data Management OTA for Enterprise Performance Profile Modeling. I led a high scale program focused on top 5% of customer base (>150 million records, thousands of transactions per second, and high license/services revenue).
I developed profiling and modeling strategies for distributed large scale bulk cross matches and distributed real time entity resolution.
Presenting Data and Information — 2000 & 2009
A workshop presented by Edward R. Tufte on information design. These seminars have heavily influenced my data visualization strategies.
Internetworking with TCP/IP; Concepts and Practices — 1999
A 1 week training class on TCP/IP.
Now I’m just braggin’
I hate C.V.’s. It’s all about the hype. I can’t believe you’re still reading. So just move on through this section, unless you are thinking of hiring me. Then read all this marketing fluff and hopefully you’ll think I’m just awesome and hire me. I wouldn’t trust marketing stuff though – have you read Dunning Kruger? Everyone thinks they rock. Don’t trust my resume – it should be all about the data. Seriously. Check out my portfolio. The pictures are way more awesome than this text stuff. But I had to write all this, because HR people want resumes on file, not wicked cool portfolios of impactful data visualizations.
Workload scale, product performance
I built the product scale and workload analysis program for the Initiate Master Data Service, IBM MDM Standard Edition. This high scale capability was specifically called out by Gartner:
Strong performance and industry focus: SE has strong proof points for extremely high volumes of business-to-consumer (B2C) data, with sub second latency and high transaction rates. SE is very strong in the healthcare market where registry is a common requirement, and it continues to do well in the government sector where complexity in application landscapes lends itself to the registry style.
Magic Quadrant for Master Data Management of Customer Data Solutions
11 November 2015 | ID:G00271783
I understand the revenue impact of my work
Most technical folks don’t necessarily understand revenue and support models. I’ve been exposed to both tactical account targeting to meet revenue objectives, as well as strategic investments in key clients that help drive product initiatives forward. I’ve worked with pre-money products, as well as established products that focus on driving down E:R. A few examples of strategic deals that I have worked on, or salvaged:
- Provided ongoing implementation workload scale support for federal account that drove $49M total revenue over 2 years (including $5.4M software, $14M services Q4 2013, $5.6M software, $16M services Q3 2015).
- Lead field workload profiling effort that over came technical obstacle to landing a $2.8M license, $6.6M total revenue over 5 years for a large scale prescription account.
- Drove revenues from $3M (1997) to $8M (1998) & $13M (1999) leading technical sales effort for WBT product line.
I can actually work with sales people and customers
The combination of my technical background and sales engineering experience provides a unique perspective – I understand the pressures of closing deals, and the technical support often required to do so. I can work with sales teams on critical accounts, helping knock down any technical barriers to product adoption.
Jim deserves a customer excellence award if anyone does. Jim was relentless in his pursuit of resolution of a v10.1 performance issue which threatened to kill our deal. Literally sleepless nights for him as he and team crunched through this. Customer feedback was unanimously positive.
Jim O’Neill has consistently provided phenomenal performance support to NDEX. His ongoing insight into their issues and bottlenecks has allowed our services to shine and the customer to be able to maintain their mission objectives. Thank you!
Thank you for always being willing to help and mentor. We appreciate all the additional work and guidance.
Jim, since I’ve known you you’ve proven to be an extremely technical, savvy and responsive individual. Your recent replies on my customer CRMs continue to lend credence to this observation. This is just a general thank you for the quality and breadth of support responses you’ve provided and continue to provide for tough performance-related issues at multiple customer sites.
Thank you for being so generous with your time for the [customer] performance issues and for going above and beyond to help the customer. Your help and guidance on this client engagement has been invaluable.
Jim – congratulations on receiving an Outstanding Technical Achievement Award (OTAA) for your technical leadership and contributions to the enterprise profiling model for MDM performance.
I have a thing for information design
I enjoy creating beautiful, impactful data visualizations that make complex concepts or very large data sets accessible to non-technical folks. Making inaccessible data or concepts accessible to others is not just a challenge, but a passion. You can find a variety of examples of my visualizations here.
And there’s the usual self-promotion across an array of experience
Corporate and Product Strategy – key contributor to the development of product strategy including market segmentation and targeting, product positioning and pricing, and distribution and support strategies.
Business and Technical Operations – over 5 years experience managing business and technical operations for technology startups. Responsibilities spanning program and project management, technical sales and product marketing, and infrastructure and QA support.
Program, Project, & Product Management – successfully drove multiple whole-product initiatives; Internet appliances, thin clients, enterprise management solutions, ASIC development and server acceleration software. 10+ years of project management from high technology to cutting edge analytical chemistry process development.
Relationship Management – extensive experience managing key relationships including OEM customers, flagship corporate clients, strategic product development partners and critical product alliance partners.
Sales Engineering – worked extensively with sales staff effectively driving revenue through pre-sales customer training, the development of technical sales tools, and detailed, personalized support during the post-sales period. Saved multiple accounts through proactive relationship management.
Network Consulting, Performance Analysis – designed, sourced and assembled a state of the art enterprise performance lab capable of simulating large-scale database, messaging, file and web server simulations. Extensive background in diagnosing server performance issues.
Marketing Collateral & Technical Writing – developed a wide variety of marketing collateral including the design, layout and writing of brochures, datasheets, websites, and presentations. Authored a wide variety of user guides and product white papers.
presentations
A summary of a variety of data-centric presentations made to audiences varying from 10 to 150 attendees. Content varies from corporate to academic materials, from formal scientific presentations to routine webinars.
- O’Neill, J.,2008. High scale performance tuning Initiate MDE. Three day training seminar.
- O’Neill, J., 2005 – 2006. Technical Overview; Quickshift for MS SQL Server Briefings. Presented via a monthly webinar series.
- O’Neill, Jr., J. A., 2003. Merging Strategic Marketing Planning and Technical Product Development Using a Risk-Driven Process Model to Improve Short-Cycle Product Development. Presented at the Executive Engineering Management Summer Workshop.
- O’Neill, Jr., J. A., 2002. Enhancing Organizational Communication by Visualizing the Matrix Scheduling Theory. Presented at the Executive Engineering Management Summer Workshop.
- O’Neill, Jr., J. A., 1995. The Separation of the PGEs by Cation Exchange Prior to Analysis by USN-ICP-MS. Presented at the 1995 Annual Meeting of The Geological Society of America.
publications
The majority of the scientific publications listed below were the work product of laboratory process development conducted during my thesis work at the University of Notre Dame. The second and third authorship credits are attributions to the processes I developed which were used extensively following the completion of my work.
- Wang-Stockton, S., O’Neill, J., 2005. IT Strategies that will Boost Server Performance. Enterprise Network and Servers, Vol. 11 No. 4, 20.
- O’Neill, Jr., J. A., 2003. Organizational Spiral Planning: Unifying Business and Engineering Product Development Processes. MSE Thesis, University of Texas at Austin.
- O’Neill, Jr., J. A., 2002. Enhancing Organizational Communication by Visualizing the Matrix Scheduling Theory. MSE research project, University of Texas at Austin, 31 pp.
- Ely, J.C., Neal, C.R., O’Neill, J.A. Jr., Jain, J.C., 1999. Quantifying the platinum group elements (PGEs) and gold in geological samples using cation exchange pretreatment and ultrasonic nebulization inductively coupled plasma-mass spectrometry (USN-ICP-MS). Chemical Geology 157, 219-234.
- Neal C.R., Ely J.C., O’Neill J.A., and Jain J.C., 1997. Determination of platinum group elements (PGEs) and gold (Au) in silicate rock matrixes using ultrasonic nebulization inductively coupled plasma mass spectrometry (USN-ICP-MS): A cation exchange method to replace NiS fire assay. 4th Australasian Symposium on Applied ICP-Mass Spectrometry, MacQuarie University, Sydney Australia, 11-15 May.
- Snyder G.A., Neal C.R., O’Neill J.A., Jain J.C., and Taylor L.A., 1997. Platinum-group elements (PGEs) and Gold (Au) in the lunar regolith: Routine analysis by ultrasonic nebulization-inductively coupled plasma-mass spectrometry. Lunar Planet. Sci. XXVIII, 1353-1354.
- Jain, J.C., Neal, C.R., O’Neill, J.A. Jr., 1996. Origin of the Ontong Java Plateau OJP at the core–mantle boundary: platinum group element (PGE) and gold (Au) evidence. Transactions of the American Geophysical Union, EOS 77, 714.
- O’Neill, J.A. Jr., Neal, C.R., Jain, J.C., 1996. Addressing Heterogeneous Distribution and Trace Abundances of Platinum Group Elements (PGEs) and gold (Au) in silicate rock matrixes: quantitative analyses using Ultrasonic Inductively Coupled Plasma-Mass Spectrometry (USN-ICP-MS). Transactions of the American Geophysical Union, EOS 77, 772.
- O’Neill, Jr., J.A., 1996. Development of an ICP-MS analytical technique for the quantification of the platinum group elements (PGEs) and gold in geological samples using cation exchange pretreatment. MS Thesis, University of Notre Dame, Notre Dame, 122 pp.
- Jain, J.C., O’Neill, J.A. Jr., Neal, C.R., Mahoney, J.J., Petterson, M.G., 1995. Siderophile elements in Large Igneous Provinces (LIPs): origin of the Ontong Java Plateau at the core–mantle boundary? Transactions of the American Geophysical Union, EOS 76, 700.
- O’Neill J. A. Jr., Neal C. R., and Jain J. C. (1995) Determination of platinum group elements and gold by inductively coupled plasma mass spectrometry following separation by cation exchange. Geological Society of America Annual Meeting, New Orleans.
- O’Neill, Jr., J.A., 1995. Trace Element Analysis of Groundwater Samples from Northern Indiana by Inductively Coupled Plasma-Mass Spectrometry (ICP-MS). MS Directed Studies, University of Notre Dame, 53 pp.